Seeing the Big Picture
What's Forming? What's Failing?
Before you trade a single symbol, understand the session. The Live Session Report shows how strength is developing across all 12 markets — so you know whether today is worth trading at all.
Live Session Report
Sample Data
| Trade Runs | Strong Runs | Signal Count | ST-1 Avg | ST-1 Max | ETH Progress | Asian | London Progress | RTH Progress | |
|---|---|---|---|---|---|---|---|---|
| Total / Range | 658 | 658 | 4,023 | 50.5 – 145.3 | 94.5 – 320.8 | 66 – 218% | 68 – 235% | 79 – 207% |
| MES | 47 | 47 | 359 | 135 | 270.5 | 87% | 68% | 111% |
| MNQ | 74 | 74 | 647 | 103.6 | 233.4 | 102% | 145% | 80% |
| M2K | 22 | 22 | 154 | 94.2 | 167.9 | 203% | 110% | 92% |
| MYM | 25 | 25 | 208 | 78.3 | 174.1 | 171% | 119% | 80% |
| ES | 104 | 104 | 663 | 133.4 | 283.2 | 153% | 102% | 106% |
| NQ | 74 | 74 | 627 | 145.3 | 320.8 | 131% | 123% | 118% |
| RTY | 47 | 47 | 326 | 101.9 | 259.8 | 156% | 235% | 90% |
| YM | 53 | 53 | 362 | 114.4 | 232.3 | 193% | 150% | 79% |
| TU | 68 | 68 | 197 | 126.8 | 243.4 | 218% | 149% | 123% |
| FV | 42 | 42 | 169 | 64.2 | 160.1 | 85% | 182% | 141% |
| TY | 80 | 80 | 237 | 80.8 | 170.7 | 151% | 134% | 154% |
| US | 22 | 22 | 74 | 50.5 | 94.5 | 66% | 85% | 207% |

For educational purposes only. Trading involves substantial risk — you may lose more than you invest. Never trade with money you cannot afford to lose. Signal data may be delayed or interrupted due to market conditions, system errors, or connectivity issues. All content on strongertrades.com is proprietary and may not be reproduced or distributed without written consent from STRONGER TRADES.

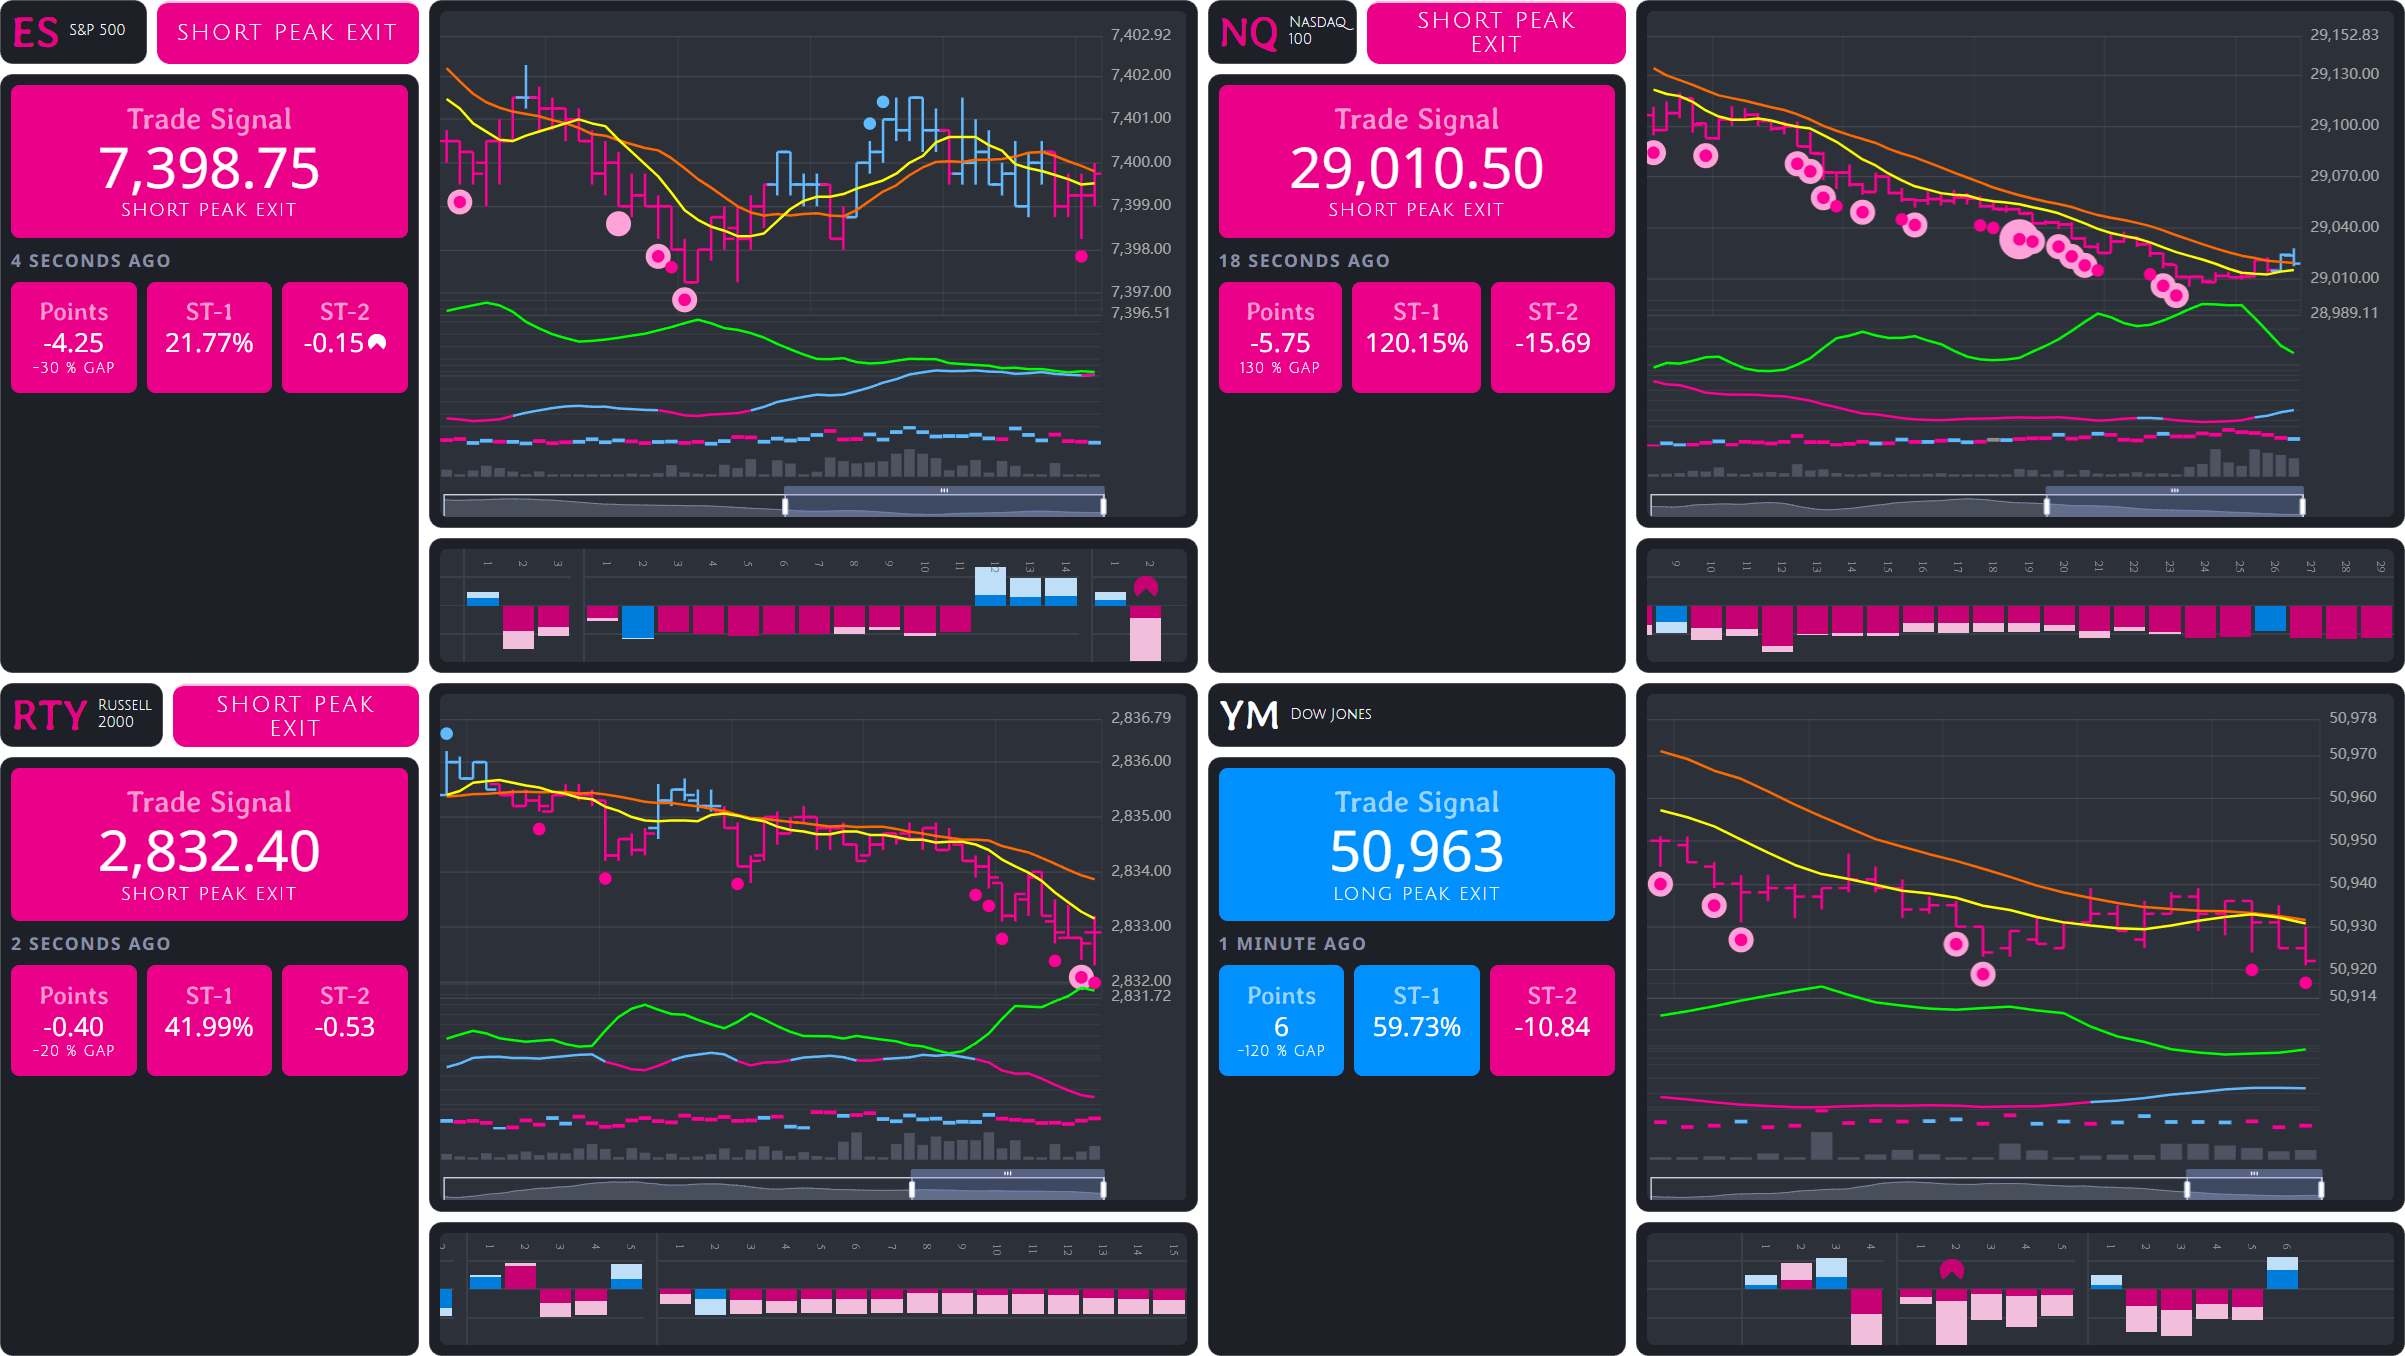
Where the Opportunity May Be
When a market starts moving, the GRID shows you whether others are moving with it. Identify where the real opportunity is forming before you commit.
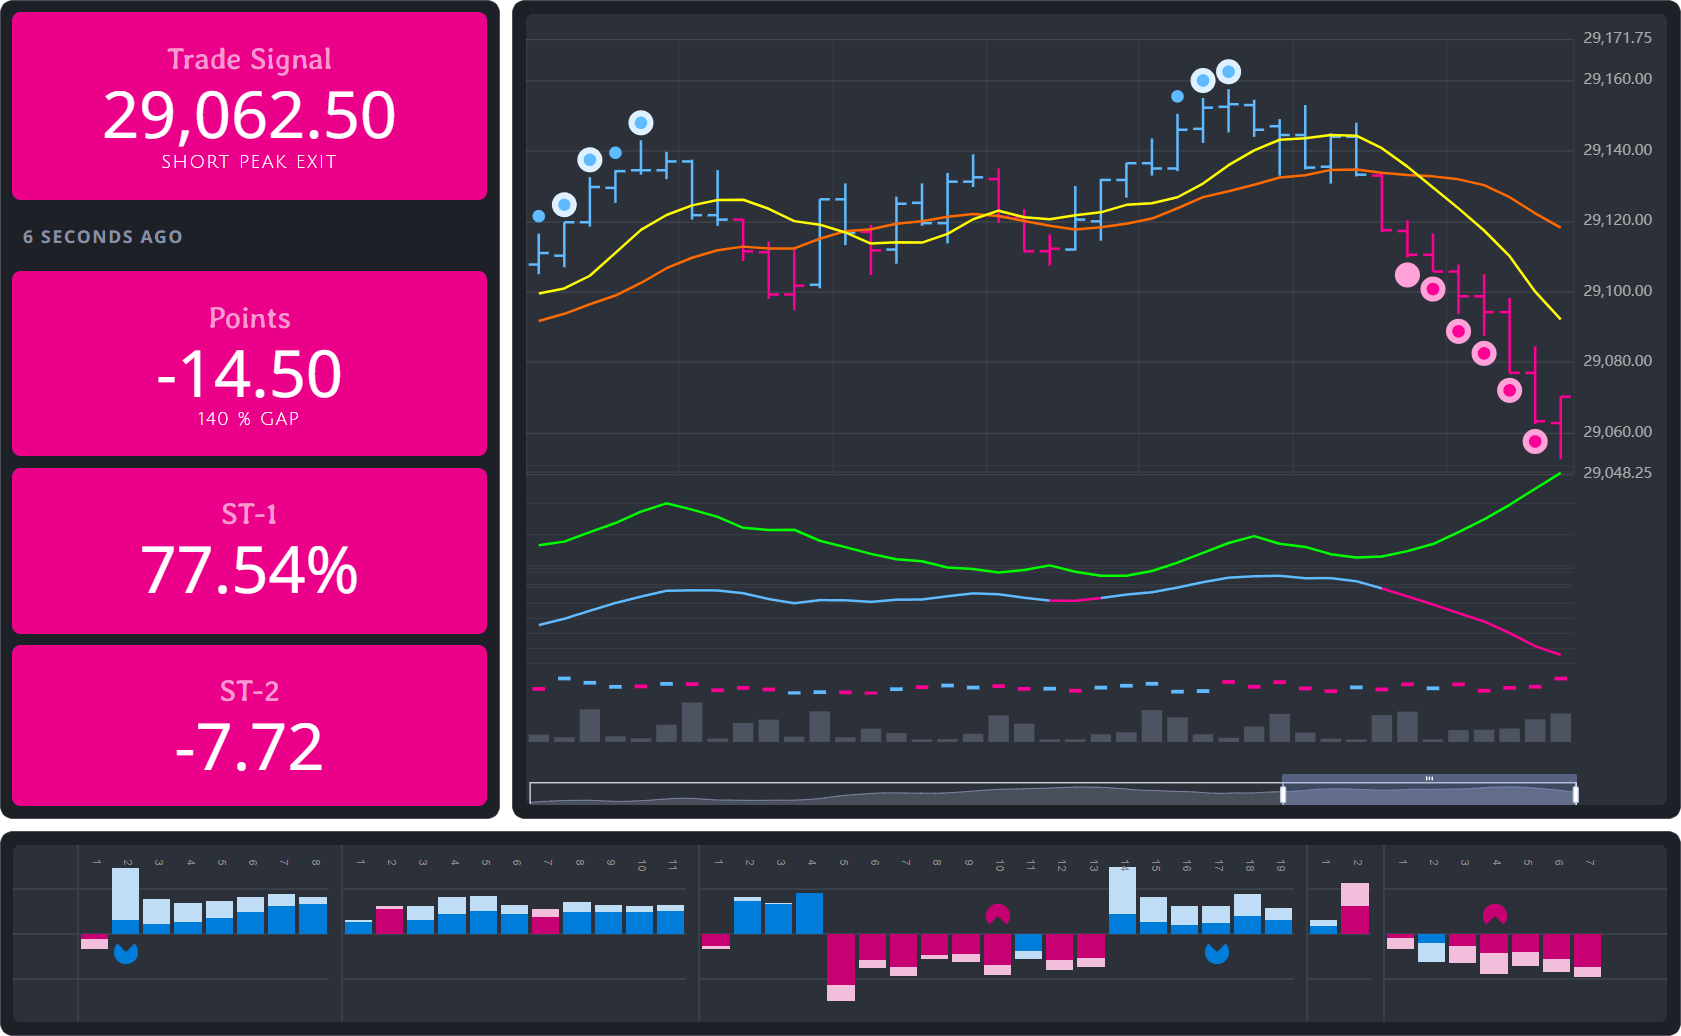
What's Happening Right Now
Once you've found your market, the signal page gives you everything — live price, signal type, strength, chart, and trend bar. One page. One decision.